What does an Inventory Management System usually include?
An Inventory Management System (IMS) is a set of software and hardware that helps companies effectively manage their product inventory.
The main components of an inventory management system are:
- Inventory Tracking: Inventory management systems track the quantity and location of goods in real time, including information on quantities, expiration dates (for perishable goods), distribution to warehouses, etc.
- Demand Forecasting: Inventory management systems use algorithms and data to forecast future demand based on historical data, seasonal trends, and other factors.
- Order and supply management: IMS automates order and supply processes. Based on demand forecasts, the system can create orders as needed, optimizing quantities and delivery frequency.
- Optimization of inventory levels: Inventory management systems strive to maintain optimal inventory levels by minimizing the availability of surplus inventory.
- Reporting and analytics: IMS provides reports and analytics on inventory status, product turn rate, order performance, and other key metrics to aid in strategic decision-making.
- Integration with other systems: Often inventory management systems are integrated with other business systems such as sales accounting systems, and ERP (enterprise resource planning systems) to ensure data synchronization and improve business process management.
IMS can be either a software product provided by third-party companies or developed in-house. In this article, we will talk about our own experience of developing such a system.
What benefits Inventory Management System can provide
Here are a few common examples of savings from optimizing inventory management:
- Reduced storage costs: By reducing excess inventory levels and increasing product turnover, companies can reduce the cost of storing goods.
- Minimizing expiration losses: Optimized management systems can help avoid losses associated with outdated or spoiled goods.
- Reducing inventory management costs: Utilizing more accurate demand forecasts and automated management systems can reduce the need for manual work and improve process efficiency.
- Improved customer service: By managing inventory more accurately, stores can ensure more consistent merchandise availability, leading to higher customer satisfaction and increased sales.
- Optimize orders and deliveries: Accurate inventory management can help with orders and deliveries by reducing the costs of rushed or sub-optimal orders and transportation of goods.
These economic benefits are often confirmed in companies’ business intelligence after implementing optimized inventory management systems. As practice has shown for similar systems, the economic effect can reach up to a +25% increase in sales due to faster system response to customer needs and cost reduction.
The main classical models of inventory management are:
- Single purchase model (static, probabilistic, and logistical);
- Profit maximization in logistical systems of single purchases;
- Basic single-item dynamic inventory management models;
- Optimal reorder point model (classical economic-mathematical inventory management model);
- Optimal (economic) order size.
To assess the effectiveness of the use of the inventory management and optimization process, the abbreviation KPI (Key Performance Indicator) is used; according to its meaning, the following indicators should be regularly monitored and analyzed for effective inventory management:
- Inventory levels (the application tracks optimal orders)
- Sales (goods released from the warehouse)
- Excess inventory (the empirically established safety stock is not reached within the fixed delivery period)
- Lost sales (a shortage of goods occurs – optimal inventory is adjusted +/-)
- Percentage availability
- Inventory turnover
(studies of this process conclude that it is not worth using more than 10 indicators for any unit of management system (our implementation uses these six above parameters)).
IT-Dimension’s example of a mathematical model for calculating an inventory management system
The app was implemented in C# using the MySQL DBMS. The classical Wilson model using constants was taken as a basis.
Wilson’s EOQ” (Economic Order Quantity) model is a model that is used to determine the optimal order size that minimizes the total cost of inventory management.
The basic assumptions of the Wilson model include:
- Fixed order costs (S): The costs associated with placing an order are assumed to be constant for each order.
- Constant holding costs (H): The costs of holding inventory (storage, maintenance, etc.) are assumed to be constant per unit over some time.
- Constant purchase costs (D): The costs of purchasing a good are assumed to be constant per unit of the good.
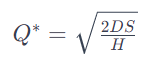
Wilson’s model allows us to determine the optimal order size (Q) that minimizes total costs. The formula for calculating the optimal order size is as follows:
Where:
- Q* is the optimal order size,
- D – fixed costs of purchase,
- S – fixed costs of ordering,
- H – holding costs.
Classic Wilson’s model provides a trade-off between ordering costs and holding costs, helping organizations effectively manage their inventory and minimize total costs.
Back to our mathematical model. OCMT model (as a synthesis of the models described above and practical experience studied) has the following parameters in its abbreviation:
O – Optimal (optimal inventory of a specific product in the warehouse) C – Current (current inventory of the product based on inventory data (calculated programmatically)) M – Minimum (minimum (safety) inventory, upon reaching which a reorder must be made to the optimal (O) level, and it should be sufficient to release goods from the warehouse until receiving this reorder (empirically determined based on statistics, like the O-parameter)) T – Time/Period – order period (this model parameter is related to the specifics of relationships with the supplier, who may require strict order periodicity and possibly a fixed quantity of delivery – can be calculated programmatically based on statistics).
Let Z be the reorder quantity, t’ be the date of the last order, t be the current date, and Q = C – M (shortage/excess depending on the sign). Then if (t’ + T >= t) – a reorder is executed (in continuous monitoring mode) for the quantity Z = O – C + Z (*).
If the T parameter is not used (it is calculated programmatically if needed), then a reorder is executed when the safety stock level is reached (C <= M, Z = O – C) – an imperative reorder condition for which the formula (*) can also be used.
During the model’s operation, all these parameters are optimized – statistics are maintained programmatically, and the optimization goal is to minimize deficits, excesses, overdue items, and illiquidity.
Wilson’s classical model in the theory of inventory management and its various generalizations continue to play an important role in the theory and practice of logistics management. In particular, there is great theoretical and practical interest in its development in the following directions:
a) Accounting for possible risks associated with the variation in delivery times of ordered batches of goods to the supplying firm, as well as random fluctuations in demand for the product. b) Joint planning by the supplying firm of purchasing goods and delivering them to consumers by means of transportation. c) Investigating the influence of a firm’s procurement policy on the organization of the production process at consumer enterprises.
To some extent, these workflows are considered in our implemented model, which can be modified/customized for specific needs.
Our implemented inventory management system and its operation peculiarities. Implementation of OCMT model
It should be noted that the shown app is currently implemented as a prototype and integrated into the mobile application of an auto service; its use is intended for optimizing the delivery of goods. The database data provided below are irrelevant and were arbitrarily entered for model debugging/testing; accordingly, the results are conditional (schematic).
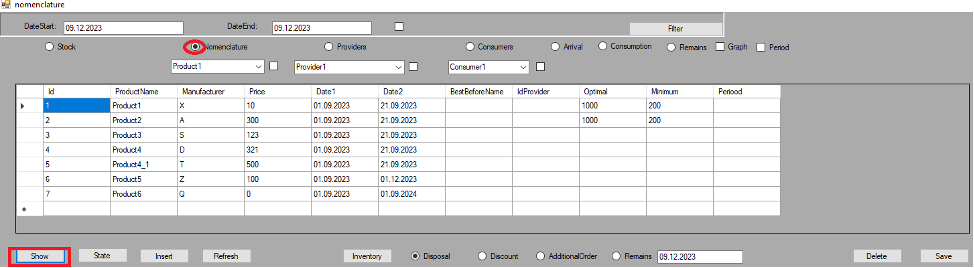
Similarly to DBMS applications, the system operation starts with the creation of the necessary directories (MySQL tables).
For programmatic work with tables (viewing and editing in the user GUI), the DataGridView component is used, linked to the results of an SQL query, e.g.:
sql = “SELECT * FROM ” + _tableName + ” WHERE NameProvider = ‘” + comboBox1.Text + “‘”;
_adapter = new MySqlDataAdapter(sql, _connection);
_ds = new DataSet();
MySqlCommandBuilder commandBuilder = new MySqlCommandBuilder(_adapter);
_adapter.Fill(_ds, _tableName);
dataGridView1.DataSource = _bsource;//displaying query data (String sql)
(the variant proposed here is universal for the whole application – the ShowData(_tableName) method)
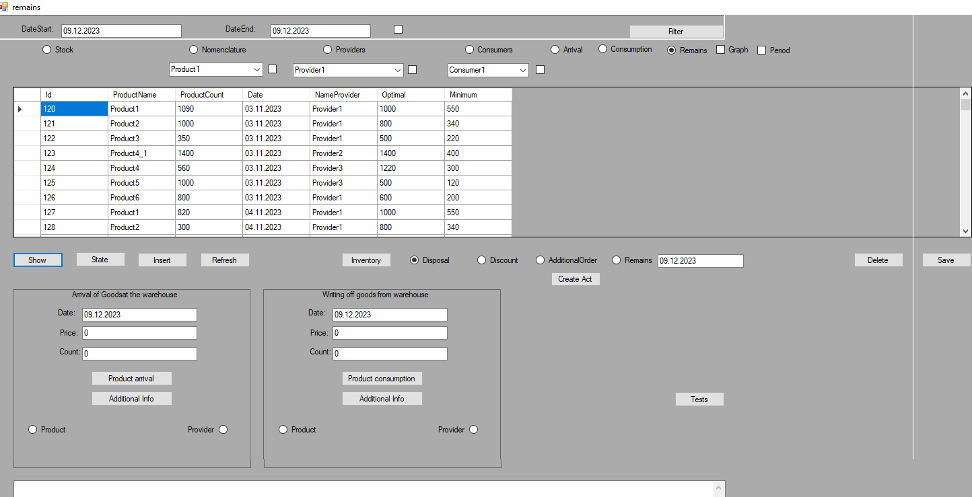
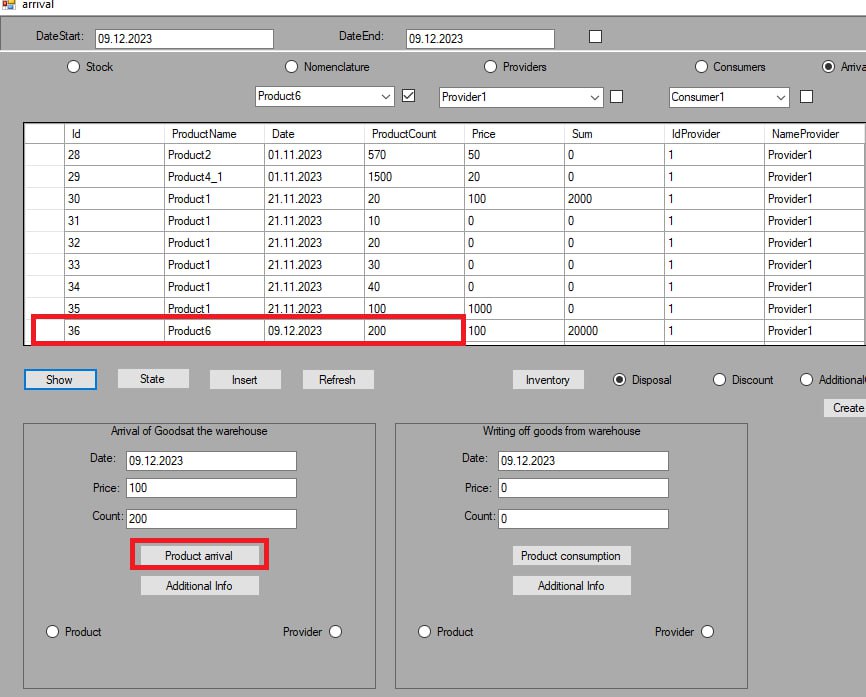
Initial stock balances are entered manually using the [Insert] button or the option described below (the [Arrival product] button). The edited data is saved with the [Save] button.
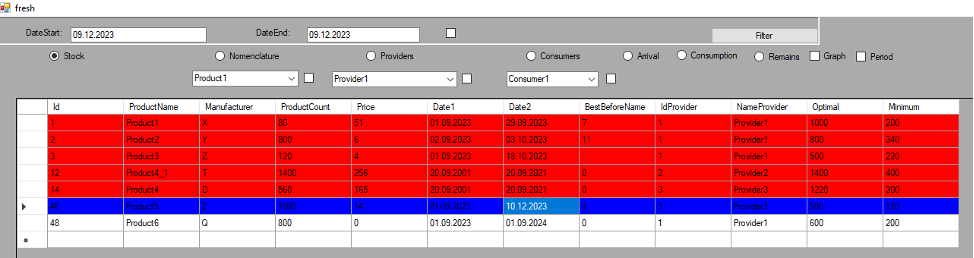
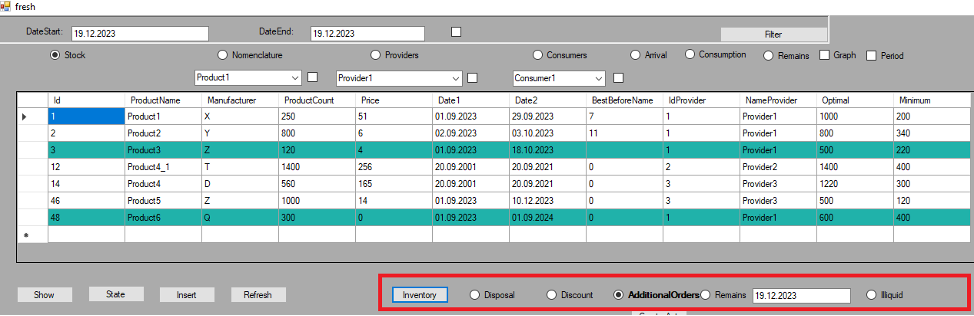
The information about the state of products in the warehouse can be obtained by clicking the [State] button: items marked in red are subject to disposal, while items marked in blue require action (e.g. applying reduced price) – their expiration date is approaching.
The general dynamics of goods movement is implemented as follows: arrival of goods to the warehouse – placing an order to the supplier by clicking the [Product arrival] button.
During this process, the “fresh” table is updated by adding the ordered goods, and data about the performed operation is added to the “arrival” table (for financial settlements with the supplier, reconciliation statements for quantitative analysis, and other purposes (#)).
Similarly, when goods are expended (removed from the warehouse – their quantity is reduced by the amount being written off), the reorder quantity is calculated, or the consumer is informed about the impossibility of performing this operation due to a shortage of goods – then a rush order can be placed with the supplier’s agreement.
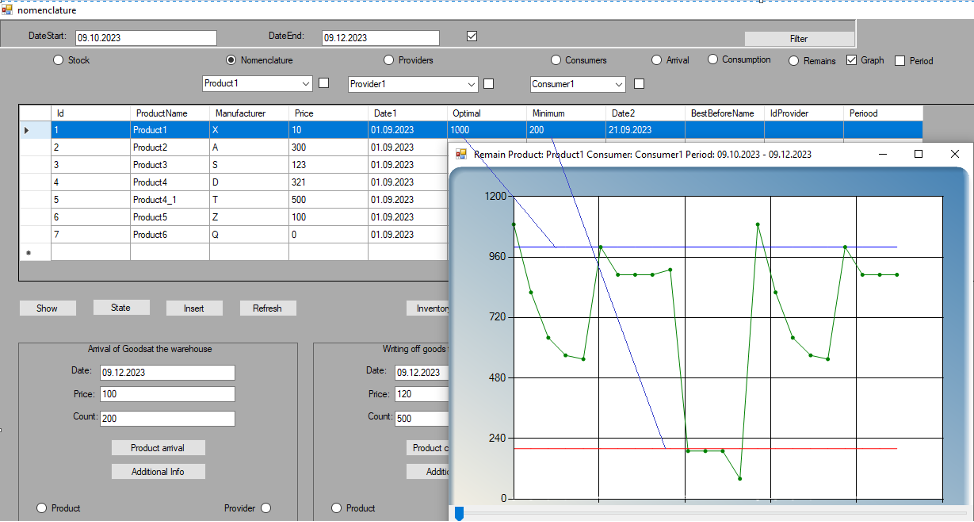
The data filtering by corresponding operations, date range, product, supplier, and consumer is also implemented, as well as their graphical visualization (to analyze the peculiarities of product dynamics).
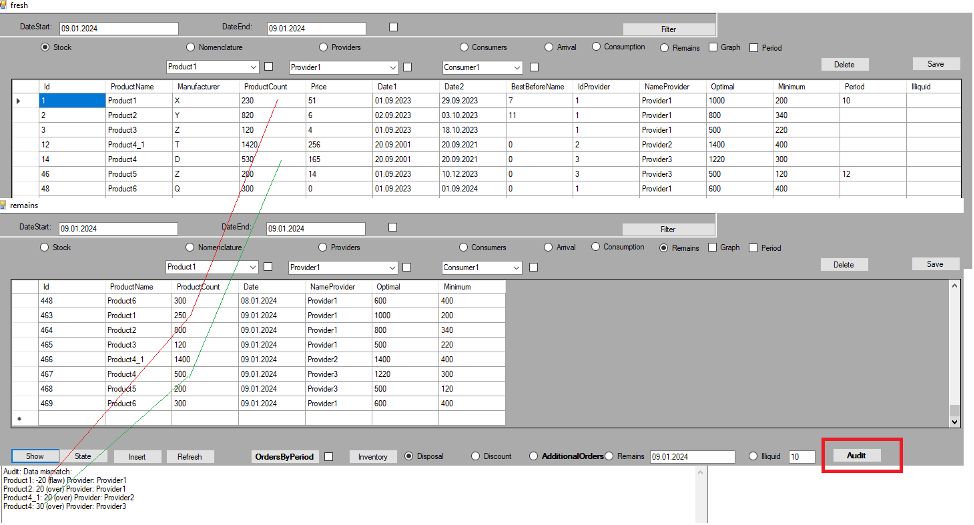
The [Inventory] panel holds special significance, allowing for real-time inventory checks of the warehouse to identify remaining stock, excess, non-moving items, shortages, and the necessity to place orders for required goods at any given moment:
The Audit feature is also available, distinguishing it from Inventory. While inventory is automated based on database information and is conducted regularly (daily and at shift ends), audit involves manual recounting or comparison with surveillance footage. Audits occur less frequently but help identify discrepancies between recorded and actual data for individual items, allowing for the determination of causes behind shortages and surpluses.
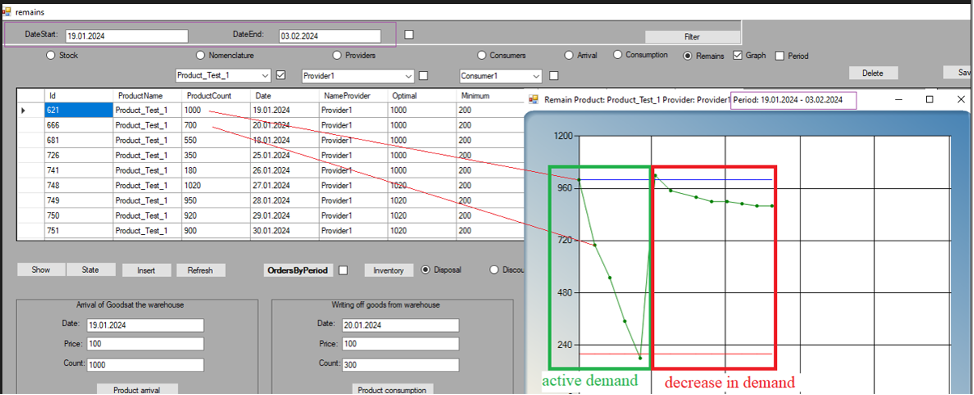
The dynamics of product demand and potential solutions resulting from its analysis
Modeling the dynamics of changes in product demand is based on an auto-test system: the green ROI represents normal (effective) demand for the product, which can be successfully released from the warehouse even in the context of perishable goods. The red area (poor product realization) may necessitate the disposal of remaining inventory.
The provided graph, generated using the [Filter] feature when selecting the radio button (.) Remains, checkboxes for products (selecting the required item from the inventory), and [x] Graph (enable graphical display), enables a prompt assessment of the situation with a specific product and facilitates appropriate decision-making: disposing of excess inventory, reducing optimal orders, or changing product suppliers (opting for similar items of better quality).
Conclusion
Efficient inventory control systems are essential for minimizing product spoilage and financial losses. Inventory Management Systems play a vital role in maintaining accurate stock levels, enabling timely replenishment, and supporting strategic decision-making. Benefits include improved operational efficiency, cost reduction, and enhanced customer satisfaction.
Mathematical models aid in predictive analytics and demand forecasting, mitigating stockouts and overstock situations. Our implemented inventory management approach shown in this article emphasizes adaptability and scalability to address dynamic market demands. Based on the results of the conducted testing, this solution proves to be pretty effective, enabling avoidance of both excess inventory and shortages while minimizing the risk of product disposal.
At IT-Dimension, we continue to work on inventory management approaches and refine some of their functionality. We also develop a standalone application with menus and forms, which includes the optimization of logistics (based on existing developments, involving the creation of a Hamiltonian graph, its visualization on Google Maps, and the generation of a list of trips).
For commercial use of this or similar custom apps for a specific warehouse, it is crucial to clarify the details in the context of interaction with the supplier and customer, so the app’s functionality meets the unique needs of this or that business. Moreover, there’s potential for scaling the app by incorporating a centralized distribution center and establishing a network of warehouses.
Contact us to discuss your future business automation system. Let’s boost efficiency by implementing smart solutions!